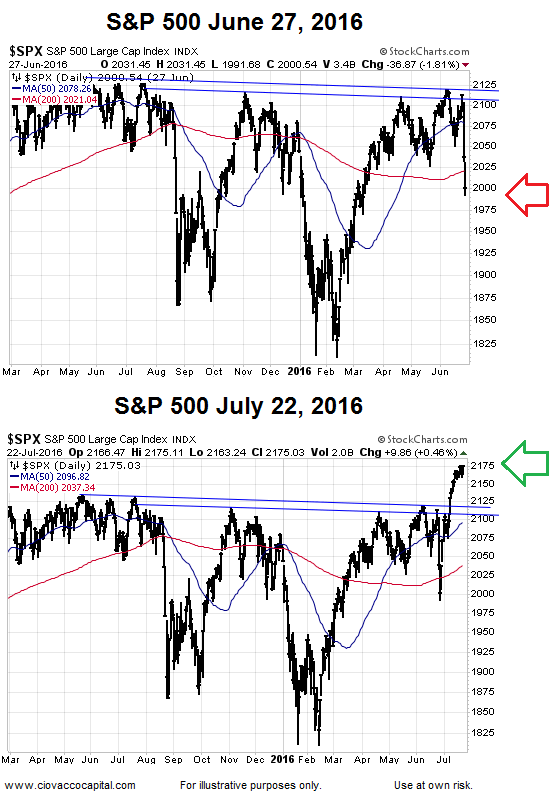
The two S&P 500 (SPY) charts below paint a starkly different picture from a risk-reward perspective. On June 27 (top), the S&P 500 was below prior resistance, inside the long-term trading range, below the 50-day, and below the 200-day. As of July 22, the S&P 500 was above prior resistance, above the long-term trading range, above the 50-day, and above the 200-day.
Even if the S&P 500's breakout above 2,134 holds, some ?give back? or even a retest of prior resistance may be needed to bring in additional ?waiting for a pullback? buyers.
What Messages Are Being Sent By The Markets?
This week's video breaks down the fundamental messages being sent from recent action in stocks (VTI), bonds (TLT), and precious metals (GLD). The messages from this diverse set of asset classes shed light on investor perceptions about the economy, valuations, earnings, central banks, and global debt.
After you click play, use the button in the lower-right corner of the video player to view in full-screen mode. Hit Esc to exit full-screen mode.
Busy Final Week Of July
It will not be a quiet summer week in the financial markets. From CNBC:
The coming week is packed with lots of potential market movers, starting with the release of earnings from about 35 percent of companies in the S&P 500. There's also a Fed meeting Tuesday and Wednesday, the Democratic National Convention starting Monday and a much anticipated Bank of Japan meeting at the end of the week. Before the week even gets underway, the G-20 meets in China over the weekend, and next Friday, stress test results are expected for those worrisome European banks.