This post The Best Time to Buy ANY Stock, Year After Year appeared first on Daily Reckoning. Over the past couple of days, I've been filling you in on a secret project that Agora Financial's resident quant, Jonas Elmerraji, has been working on tirelessly. As you learned on Monday, I've been using Jonas' algorithm to pick select trades since January. In the real-world test, his software has netted us gains on every single trade it identified. Yesterday, I showed you how his system automatically identified a massive 26% rally in shares of tech behemoth Apple Inc. (NASDAQ:AAPL) a full year before it happened. And how it got you out with those gains before the recent tech selloff took effect. As a refresher, here's the Apple chart from yesterday: 
As promised, I'm about to show you when the next buy window swings open in Apple. But first, I want to show you how it all works? As I mentioned a moment ago, Jonas' algorithm is designed to pick out tail winds in the market, and in individual stocks. He calls these "Kinetic" moves. To find them, Jonas created a proprietary indicator that can identify a stock's strongest periods year after year. It shows when a ticker symbol is statistically most likely to be in motion ? thus the ?Kinetic? part of the name. In the Apple chart above, the first Kinetic Window hit between January 27 and May 27. That was the first timeframe when the wind was at Apple's back and shares were most likely to get pushed higher. That set the stage for the 26% rally that got set off at the beginning of the year. But it wasn't the only move to pay attention to in Apple. You see, most stocks have several distinct Kinetic Windows each year that identify the best times to buy. Apple has two windows each year. (I'll show you the second one in a moment.) Bank of America has two as well. Industrial giant General Electric has four predefined windows in 2017. Gold miner Barrick Gold is another four-banger. And pharma giant Merck has three Kinetic Windows pre-set for this year. Of course, Jonas' algorithm doesn't only work in big, household name stocks. It also works in countless smaller, less popular stocks. Many of those make some utterly massive moves during their Kinetic Windows. And those Kinetic Windows show up on the chart clear as day ? up to a year before they begin. And you don't need to guess what the dates are, either. The computer spits out specific buy and sell dates. So exactly what causes a Kinetic Window to show up on the chart? I'll break it down for you? First, Jonas' algorithm looks at the long-term price action for a stock (typically 20 years), and processes it into a single proprietary indicator that the computer can then analyze for important trends. When you slap that indicator on a price chart, it forms a "K" shape. Because of that, Jonas calls it the K-Sign indicator. Have a look: 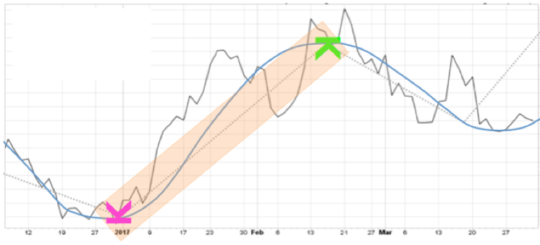
The ?buy? sign always looks like a letter K that's been tipped over on its back? that's the start of the Kinetic Window. While the ?sell? sign always looks like a K that's fallen forward. That's the end of the Kinetic Window. You can spot them on the example chart above. Working together, these two K-Signs form the beginning and end of every Kinetic Window. They're a tell-tale sign that a stock is about to kick off a tailwind - and you're one of the first people on the planet to learn about them? Going back to our Apple example, there's another window on the horizon for the tech giant: 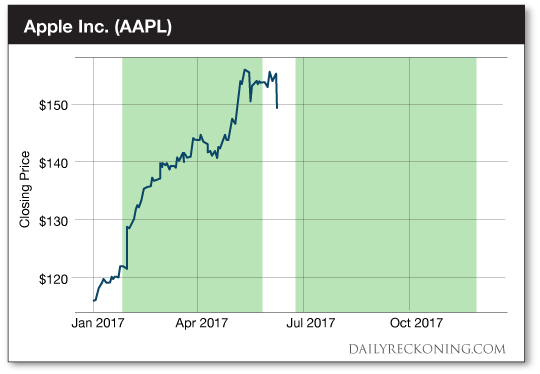
It looks like the recent plunge in Apple might be short-lived. That's because 2017's second Kinetic Window in Apple opens today, and lasts for the next 175 days. It's a powerful one too ? over the last 20 years, this long-spanning window has generated average returns of 35.5%. Of course, not all Kinetic Windows are so long. But when the computer spots a K-Sign, we know we have a statistical advantage. Tomorrow, I'll show you just how much of an advantage it actually is. And I'll show you how you can spot K-Signs on any stock chart you're interested in. This is where things really start to come together. Sincerely, Greg Guenthner
for The Daily Reckoning The post The Best Time to Buy ANY Stock, Year After Year appeared first on Daily Reckoning.  |