This post Airlines To Surge - Once Faux Stats Stop Getting In The Way… appeared first on Daily Reckoning. "Dad, did you know there are 12% more orange skittles than any other color?" That's how the conversation started this weekend with my 8th grade daughter Rebekah. "We did an experiment in class. Everyone got a bag of skittles and we poured them all out in a pile and measured different things. There's also 13.1 skittles in each fun sized bag." Poor Rebekah? She had no idea that she had just opened a "teachable moment" on one of my favorite subjects - statistics! Over the next few minutes, we talked about different methods for gathering statistics, the different meanings (and non-meanings) that averages and percentages can give you, and how statistics can be important in life decisions. Today, I want to share a couple of key statistics that are affecting the market right now. And more importantly, I'm going to show you one area that will pad your brokerage account with some unexpected gains. So let's get started! Lies, Damned Lies and SkittlesMark Twain popularized the concept that there are three types of untruths: "lies, damned lies, and statistics." That's because so often, statistics are manipulated to only give us a distorted picture of what is going on. "Do you like orange skittles?" I asked Rebekah. "No Dad, they're gross! None of my friends like the orange ones either." she said. "Is there any chance your friends were snacking on a few skittles before the experiment?" Rebekah smiled? "Well, I did eat a couple of purple ones before we started counting. They're my favorite." We talked about how if a few students ate some non-orange skittles, it would distort the statistics. There would naturally be more orange skittles because Rebekah and her friends weren't eating that color. Plus, the average of 13.1 skittles per bag wasn't accurate if students were eating a few before counting. Plus, we talked about how with just a few students in the class, the numbers could be off just because of random chance. It could be that the skittles factory randomly spit out a few extra oranges in the bags that these kids opened, but over time, the factory made just as many of each color. If you measured 100 bags - or 1,000 bags - chances are that the colors would be much closer to an even percentage of each. So what does all of this have to do with protecting and growing your wealth? Let's take a look at some of the recent statistics in the market and see how they may or may not tie to our investment opportunities. Jobs, Wages and TrafficEach month, we're treated to a host of economic data from the previous month. This data helps us discern whether the economy is growing or shrinking. And it helps us determine what industries and sectors are likely to be good investments. One of the most important pieces of information I look at each month is the jobs report. Unfortunately, for the month of September, the U.S. economy actually lost 33,000 jobs.1 This was the first time since 2010 that the economy failed to add new jobs. 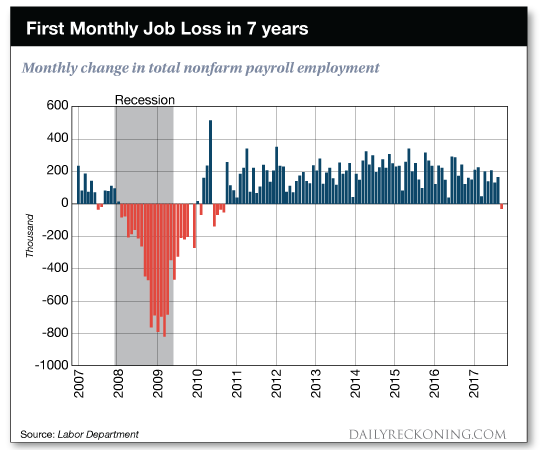
So does this mean that the recovery is over? And that you should sell all your stocks and go to cash? Hold on a minute, and let's look a bit more closely. As it turns out, hurricanes Harvey and Irma are largely to blame for the jobs lost in September. Many food service and other retail workers were out of work in September because restaurants, stores and other businesses had to shut down for the storms. But this loss of jobs is actually just a temporary issue (not a negative data point for the economy). After all, many new jobs will be created in the construction industry as homes are rebuilt and businesses get back on line. Plus, restaurants and stores in the affected areas will see an increase in business this fall as construction workers come to the affected towns and need places to eat, sleep, shop and so forth. So while on the surface, the jobs data appears to reflect a weakening economy, that's not actually what is happening. The underlying strength of the U.S. economy is continuing its trend, and we should see the statistical numbers jump back over the next few months. So if statistics like these are so unreliable, why even bother following them? Statistics are still very helpful when you understand how they are compiled, and you take into account any issues that may distort the data. Consider the recent data coming from the airline industry? Delta Statistics Show Underlying StrengthLast week, Delta Airlines (NYSE:DAL) reported traffic statistics for the month of September. According to the data, the company announced a decline in revenue per available seat mile (a common statistic that airlines track). Delta also said that it total traffic rose 0.3% from last year.2 On the surface this is a fairly bland report. After all, if the global economy is growing, you would think that Delta would have a big increase in traffic and be able to charge more for every mile its passengers travel. A growing economy makes it easier for consumers to afford vacation travel. And business are usually more willing to spend on tickets for their workers to fly to conferences or meetings. So was this bland report from Delta a death sentence for the stock? Hardly!! 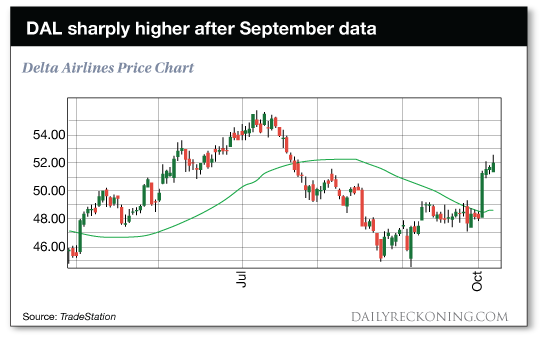
As you can see in the chart above, shares of Delta rose sharply after the September traffic report was released. Shares of other airlines such as JetBlue Airways (NASDAQ:JBLU) and American Airlines (NASDAQ:AAL) also moved sharply higher on similar reports. So what drove these stocks higher? The details behind the statistics were actually much stronger. Remember, during the month of September, hurricane Harvey and Irma ravaged key cities such as Houston and Miami. Even Delta's hub in Atlanta was forced to shut down operations as high winds made takeoffs and landings unsafe. Yet, despite these challenges, the airlines were still able to report respectable growth. Imagine what kind of growth these airlines could have generated if September had not included two of the most devastating storms in recent history. You see, statistics can at times be very misleading when it comes to what they tell us about markets and individual stocks. But if you're willing to look behind the headline numbers and see what is actually affecting the statistical numbers, you're likely to uncover some excellent opportunities that may be temporarily overlooked by Wall Street. Today, I'm very excited about the prospect of U.S. airlines. Not only was September a ?stealth positive? for these companies, the coming months should make the underlying strength even more clear. A month from now when these companies report October traffic details, I expect the strength to be even more apparent. And if you invest in these stocks before those details emerge, you'll be in a great position to capture big profits as these stocks continue their bullish advance. So if you're not yet invested in airline stocks, now is a great time to buy some shares. And next time you see a market or economic statistic that seems to be skewed in one direction, make sure you understand the underlying factors behind the headline data. Here's to growing and protecting your wealth! 
Zach Scheidt
Editor, The Daily Edge
Twitter ? Facebook ? Email 1 The September Jobs Report in 9 Charts, WSJ, Josh Zumbrun
2 Delta reports September traffic, financial performance, Delta, Kate Modolo The post Airlines To Surge - Once Faux Stats Stop Getting In The Way… appeared first on Daily Reckoning.  |