Stock Ownership Figures Look Nothing Like A Bubble
ciovaccocapital.com on 2017-11-06 16:48:01.0
A Euphoric All-In Bubble?
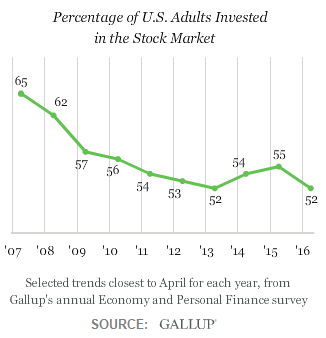
Once a year, Gallup conducts a poll that provides some insight into the sustainability of the bull market in stocks. The concept of an investment bubble implies irrational investor confidence. If skepticism and fear were near all-time, bubble-like lows, we would expect a very high percentage of U.S. households to be in the stock market, as was the case near the euphoric 2007 stock market peak (see graph below).
Are We Back To Bubble Territory In 2017?
Therefore, it would be helpful to know if stock ownership figures are back near the bubble-like 2007 levels in 2017. From Gallup:
?Before the 2008 financial crisis, 62% of U.S. adults, on average, said they owned stocks. Since then, the average has been 54%, including lows of 52% in 2013 and 2016. In Gallup's April 2017 update, 54% of Americans report having money invested in stocks.?
Household Figures Align With 2017 Annual Charts
If the stock market had a chance to go on a surprising multiple-year run from present levels, we would expect a healthy dose of skepticism and a significant amount of people not yet participating, which is exactly what the Gallup numbers tell us. We would also expect long-term set-ups in the market to be similar to multiple-year bullish set-ups in the past. This week's video explores annual charts to better understand the long-term outlook for stocks.
After you click play, use the button in the lower-right corner of the video player to view in full-screen mode. Hit Esc to exit full-screen mode.
Many Investors Remain On The Sidelines
Fear of losses is a powerful factor in the financial markets. History tells us after a major financial crisis it can take years before fear of losses is overtaken by the fear of missing gains. From Gallup:
?The stock market lost more than half of its value during the bear market that coincided with the Great Recession and 2008 financial crisis, with many investors responding by taking their money out of the market.?
The chart below shows the trend of household stock ownership between 2007 and 2016; it was not screaming ?bubble? in 2016, and it remains that way in 2017.