Were Charts Helpful In 2017 And How Can They Help In 2018?
ciovaccocapital.com on 2018-01-03 16:44:53.0
The best way to review the effectiveness of evidence-based investing in 2017 is to look back at dated posts from the last thirteen months. The posts below all appeared on Seeking Alpha between December 23, 2016 and December 31, 2017; the dates are links to the original posts:
Secular Stock Market Signals Have Occurred Only One Other Time Since 1928 - Dec. 23, 2016
Are Valuations Similar To Bull Market Peaks Concerning? - Jan. 7, 2017
How Does 2017 Compare To Historical Bubbles? - Jan. 11, 2017
How Was The Collective Mood As Stocks Started A 19-Year Secular Bull Run In 1982? - Jan. 19, 2017
Are Stocks Set Up For A 2011-Like Plunge? - Jan. 23, 2017
Fed Rate Hike History Says Bull Could Run For A Long Time - Dec. 14, 2017
100% Bullish Conclusions - No Opinions
The articles above are a sample of evidence-related posts on Seeking Alpha over the past thirteen months. If you review the entire list, you will see 100% of the fact-based posts related to stocks came to bullish conclusions. The posts are not based on personal opinions about valuations, politics, or the state of the U.S. economy; they are based on observable evidence.
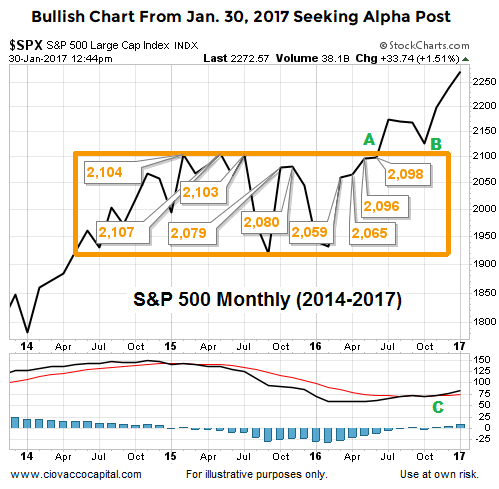
Were Charts Helpful In 2017?
The question in the header above is like asking is a golf club helpful in the game of golf? The answer depends on how the golf club is used. Charts, indicators, and ratios are tools that can be used effectively or ineffectively, just like a golf club.
This week's stock market video looks back at charts presented throughout 2017, allowing us to answer the question, can charts be used as an effective tool in the realm of investing? You can decide after reviewing the video with dated clips. The vast majority of CCM's weekly videos were included in Seeking Alpha posts in 2017.
After you click play, use the button in the lower-right corner of the video player to view in full-screen mode. Hit Esc to exit full-screen mode.
Was 100% Of The Evidence Bullish In 2017?
Could we have found bearish charts in 2017? Yes, we can always find bearish charts, indicators, or data sets; the key is to make decisions based on the weight of the evidence. The weight of the evidence was bullish in December 23, 2016 and remained that way until the last article was posted on December 14, 2017.
How Can All This Help Us In 2018?
One of the great things about the financial markets is there are an almost infinite number of ways to attack the risk-reward dragon; our approach is one of many. Under our system, the key to 2018 will be the same as 2017:
Wake up every day and ask are we allocated prudently based on the facts we have in hand?
If the answer is yes, hold ?as is?.
If the answer is no, make an incremental adjustment to get the investment allocation back in line with the hard evidence.
This approach allows us to stay fully invested in stocks when the odds are favorable (see 2017); it also gives us an exit/migration strategy for the next inevitable bear market (see 1929-1932, 2000-2002, and 2007-2009).
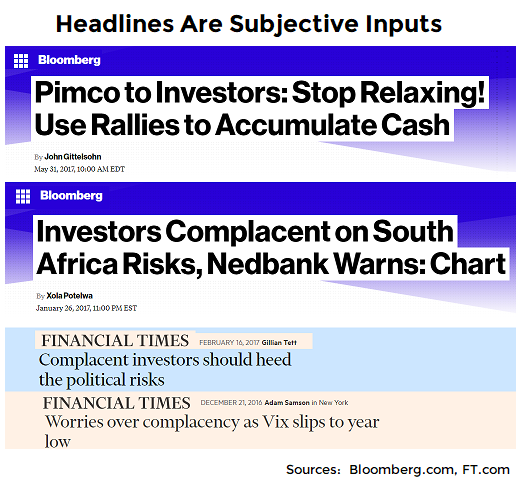
If you can quantify something and test if it works in the real world, then you have an objective input. It is nearly impossible to use subjective inputs to make rational and calculated risk-reward decisions in the financial markets. The bearish headlines below, that were not particularly helpful in a year marked by stock gains, were posted between December 31, 2016 and May 31, 2017.