This post Cry-Baby OPEC Just Got Exactly What They Wanted? (Again) appeared first on Daily Reckoning. Are you wondering why oil is off to such a rousing start in 2018? Look no further than the chart below: 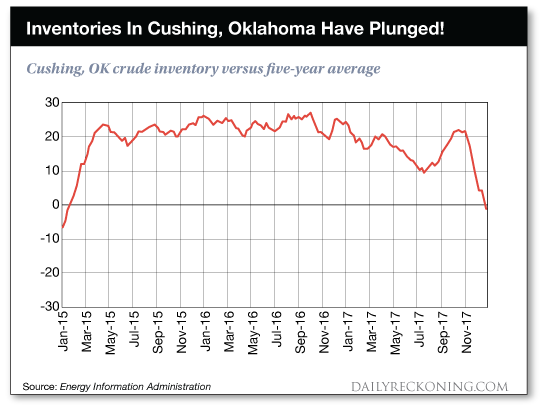
This chart depicts where the level of oil in storage at Cushing, OK stands relative to the trailing five year average. You can see in early 2015 how that inventory quickly ramped up as OPEC increased production into an already oversupplied market - bearish for oil prices. You can also see just as clearly how quickly inventory evaporated at the end of 2017 - bullish for oil prices. And after I dug further into the data, I came to appreciate just how unusual the current oil situation actually is? Days Of Crude Oil Supply ? Incredibly Bullish!In addition to providing detail on how much oil is in storage, the EIA also provides detail on how many days of oil is in storage. This piece of information tells us exactly how long it would take to consume (at current demand levels) all of the oil currently in storage. It's a more complete piece of data than just the raw storage data alone. At the beginning of September, the U.S. had enough oil in storage to last for 31 days. But that number hasn't held. Since then, U.S. crude storage has shrunk from 31 to only 24 days of coverage. This is no surprise given what we already knew about oil inventory levels coming back down. However, what surprised me is how truly unusual this decline in days of oil supply is relative to what we have historically experienced. Let me show you what I mean? The next chart shows the change in days of U.S. crude oil supply that have occurred over the last four months of each year going back to 2002. I put this data together because I believe it shows what a huge outlier the big drop in U.S. storage levels in last few months of 2017 actually is. 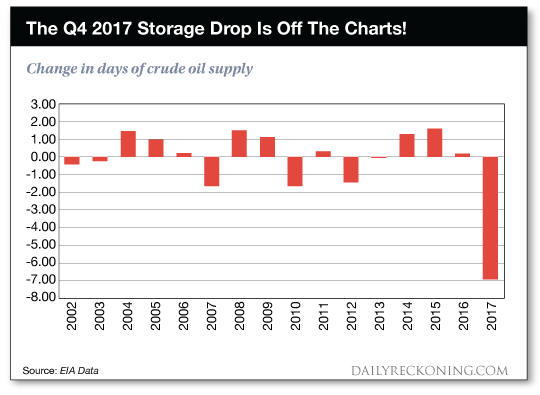
The normal seasonal move is an increase - which happens about two-thirds of the time. And in the five years other than 2017 where days of oil supply did decrease, that decrease has never exceeded 1.5 days. Until 2017? Not only did last year see days of oil supply decrease. The size of the decrease was a whopping 7 days. Over 4x the size of the next biggest move? So Exactly What Is Happening Here?I can tell you that it isn't a problem with U.S. oil production. This time last year, U.S. production was 8.94 million barrels per day. Today that number sits at 9.49 million barrels per day.1 Meaning the shale growth engine is still firing. It's the global producers that are causing the shakeup. Outside of U.S. shale, there is no other growth in production. The Saudi/OPEC/Russia group have intentionally restricted production and countries like Venezuela, Mexico and Brazil are struggling to boost output. Remember, U.S. shale production represents only about five percent of total global production. It can't cover global demand growth all by itself. Therefore, unless something changes, the global oil market is only going to keep getting tighter. Inventory levels, not just in the U.S. but around the globe, are going to continue to shrink, very quickly. That sets 2018 up to be very good for oil prices. Here's to looking through the windshield, 
Jody Chudley
Credit Analyst, The Daily Edge
Facebook ? Email 1 PETROLEUM & OTHER LIQUIDS, EIA The post Cry-Baby OPEC Just Got Exactly What They Wanted? (Again) appeared first on Daily Reckoning.  |