This post Buy Here? Sell Here? It's That Simple appeared first on Daily Reckoning. Today, I'm going to let a chart do the heavy lifting for me. The chart below compares the valuation of the S&P Goldman Sachs Commodity Index (GSCI) with the S&P 500. Take a quick look. It isn't hard to see where we are at today. 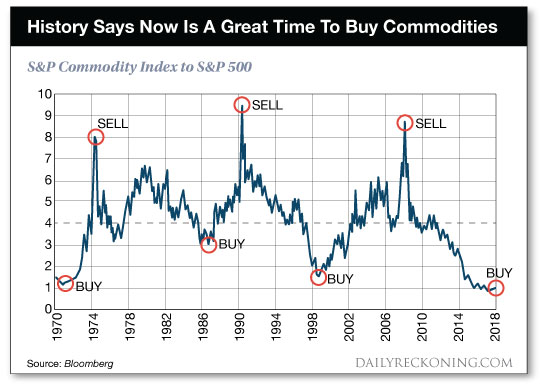
This chart tells us is that the Commodity Index has never been this inexpensive relative to the S&P 500. In other words, commodities are a screaming buy. It also tells us that historically, any time the ratio has gotten this low, the Commodity Index has bounced back very sharply? which leads us to today's buying opportunity. So What's In The Commodity Index (GSCI)?The last time the GSCI to S&P 500 ratio was at this level was in the late 1990s when the dot-com bubble was about to burst. At that time, the big technology stocks were leading the market, exactly as they are today. Over the decade that followed, the GSCI wildly outperformed the S&P 500. I'll admit that the chart is very intriguing. But before we get too excited, let's make sure we understand exactly what the GSCI is comprised of. The S&P GSCI isn't an index of stocks. It's an index of commodity futures that includes a diversified basket of commodities. Currently, 24 different commodities are included from all possible commodity sectors: - Eight agricultural products
The weighting of each commodity in the index is based on the quantity of that specific commodity that has been produced over the past five years. In other words, the more important the commodity (measured by consumption/production) to the global economy, the larger the weighting in the GSCI. The weightings are selected once per year. And right now there is one industry that is dominating the weightings. Maybe you can spot it: - Agriculture ? 18.3 percent
- Industrial Metals ? 10.9 percent
- Precious Metals ? 4.7 percent
While I have no doubt that almost all of these commodities are worthy of closer inspection, I can't help but point out the fact that this screaming buy signal is more narrowly screaming? BUY ENERGY! Energy Exposure And An 8.45% Dividend YieldI have a couple of takeaways from all of this. The first is that there is significant risk at the top of the stock market today. I am absolutely convinced of that. While the S&P 500 is still trading near its all-time highs, the gains in recent months have been concentrated in shockingly few large, popular and expensive stocks. Amazon, Apple, Microsoft and Netflix alone combined for 84 percent of the S&P 500's gain in the first half of the year. Today, we need to be avoiding those types of stocks that momentum investors love. Second, there are opportunities outside of these big expensive companies. Energy and commodities in general definitely fit that bill. A good place to start would be with the very much off-the-radar Canadian oil producer Cardinal Energy (CRLFF). Cardinal doesn't just provide us with energy exposure. At current share prices, the company yields a whopping 8.45 percent! More importantly, that dividend is fully sustainable thanks to the company's incredibly low base production decline rates. This is a business that does not need to do much drilling to maintain its existing level of production. That is not something that is common in this new age of high-decline shale oil. For 2019, Cardinal is even expecting to have enough free cash flow that the dividend could be increased. You generally don't see that from companies that already yield over 8 percent. With a sensible balance sheet and juicy yield, Cardinal Energy would be a good start towards positioning your portfolio to take advantage of the current opportunity that the GSCI chart is screaming about. Here's to looking through the windshield, 
Jody Chudley
Financial Analyst, The Daily Edge
EdgeFeedback@AgoraFinancial.com The post Buy Here? Sell Here? It's That Simple appeared first on Daily Reckoning.  |