Jordan Roy-Byrne CMT, MFTA on 2021-10-29 18:05:40.0
The oversold bounce in the gold stocks has run into initial resistance while Gold is trading around resistance around $1800.
The question is if this rebound can extend if it will pause or, will the sector start giving back some of the gains?
First, let's look at recent price action and the current setup.
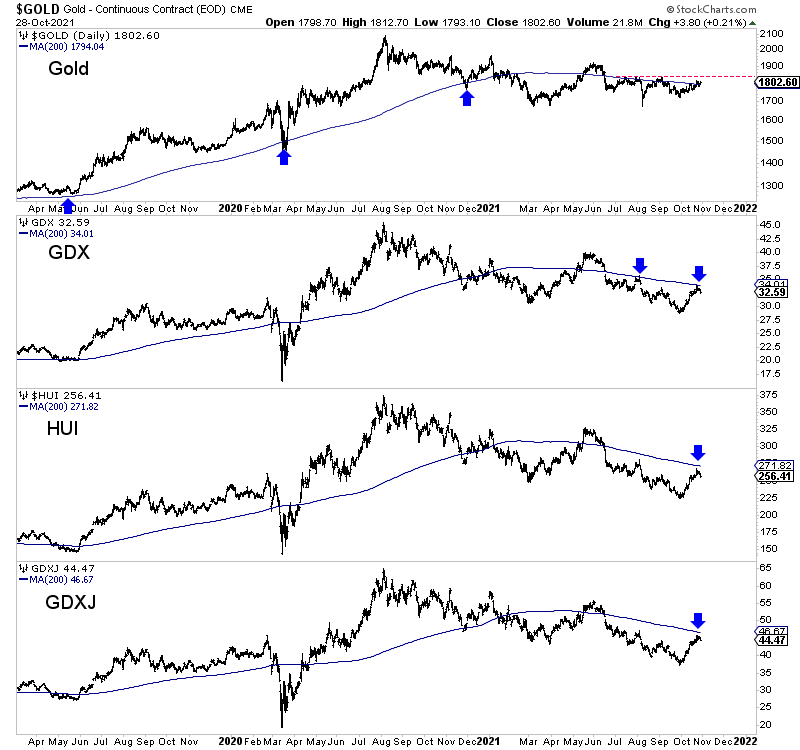
We plot Gold, GDX, HUI, and GDXJ along with their 200-day moving averages below.
Since the start of the summer, the gold stocks have trended lower while Gold has trended sideways to slightly lower.
Gold continues to wrestle with its 200-day moving average ($1794), while the gold stocks have rallied up to the 200-day moving average. The key resistance level for Gold on the daily and weekly charts is $1835.
For hints on the near-term outlook, we need to keep an eye on some leading indicators.
Here are a few I like to use.
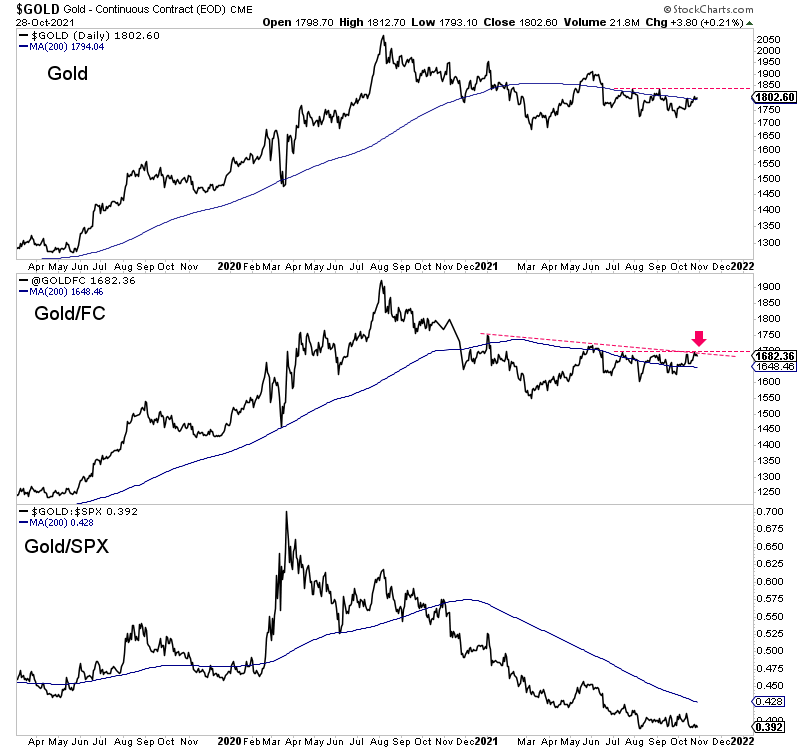
We plot Gold along with Gold against foreign currencies (Gold/FC) and Gold against the stock market in the chart below.
Gold/FC tends to lead Gold at important turning points. It has outperformed Gold over the past few months, but there is no significant divergence yet.
Gold against the stock market remains incredibly weak. That has to change if Gold is to break above $1835.
Gold, Gold/FC, Gold/S&P
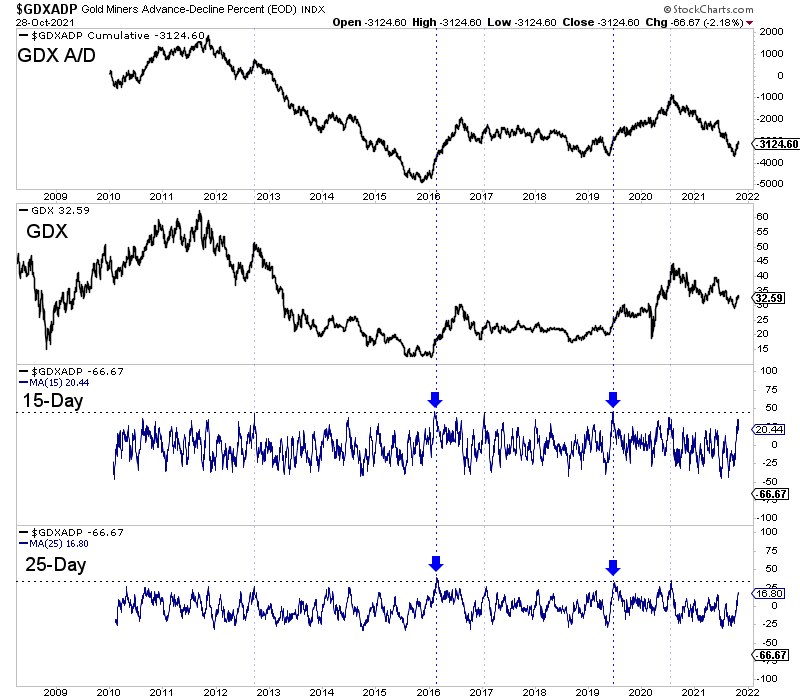
The advance-decline line is a trustworthy indicator for any market group.
We plot that below along with a 15-day and 25-day advance-decline line to measure a potential "breadth thrust." A breadth thrust occurs when a market moves from an oversold condition to strength. That is best measured by sudden strength in the advance-decline line.
Breadth thrusts occur following bottoms but sometimes can occur at market peaks.
Note the action in the 15-day and 25-day advance-decline and the surges after the 2016 and 2019 bottoms.
If GDX can show significant strength for another week or two, the 15 and 25-day indicators might signal a breadth thrust, which would be evidence of an important bottom.
GDX A/D, GDX, 15-Day AD, 25-Day AD
At present, the evidence that precious metals are going to surge past resistance is lacking. Gold has no positive divergences, and while the gold stocks have rebounded, they have not shown a breadth thrust yet.
In our last article, we explained that Gold fundamentals are not bullish yet. The market could sniff out bullish fundamentals before we notice, but history argues that the next big move in the sector will not begin until the Federal Reserve hikes interest rates.
The odds of a Fed rate hike next year are surging, with the market currently showing a 40% chance of a rate hike as soon as May.
For now, I'm focused on finding quality juniors with 7 to 10 bagger potential over the next two to three years. The recent decline in the sector has priced out much of the risk in these stocks and enhanced the potential upside for new buyers.